

Engineering Work Order Profit and Loss Analytics: Synthetic Data Platform for Revenue, Cost, Margin, Billing, and Risk Monitoring
Inside the System
Project overview
A synthetic-data-based analytics platform for estimating work-order revenue, tracking delivery-center and field-operations labor, monitoring billing and other costs, calculating profit and loss, and identifying margin risk across the engineering work-order lifecycle.
Business Problem
Engineering delivery teams often manage work orders through multiple operational and financial signals. Revenue may be represented through work units or sales-order lines. Labor effort may be recorded through activity or daily reports. Billing may arrive later through invoice or progress-billing events. Travel, permit, subcontractor, and exception costs may sit in separate sources.
This creates a visibility gap. A team may know that a work order is active, but not immediately know:
- how much revenue is currently forecast;
- how much delivery-center and field-operations labor has accumulated;
- whether billing is lagging behind operational progress;
- whether travel, rework, permitting, or other costs are consuming margin;
- which work orders are below target margin;
- which projects should be reviewed before they become losses.
This project organizes those signals into a synthetic, reproducible analytics platform that can be demonstrated publicly and later mapped to governed enterprise data sources.
The goal is not to create an audited accounting system. The goal is to create a practical operational analytics layer that helps engineering, operations, finance, and delivery leaders understand work-order profitability earlier in the lifecycle.
From: Why This Project Exists
Proposed Solution
Turn fragmented engineering work-order revenue, labor, billing, and cost records into a single explainable profit-and-loss monitoring layer—without using confidential production data in the public repository.
From: One-Line Idea
Outcome
Documented in project articleThe implemented public MVP generates the complete synthetic dataset and provides work-order P&L, billing visibility, margin/risk classification, rate scenarios, data-quality review, Snowflake schemas/views, and automated metric tests.
Cost and Risk Reduction
Not quantifiedQuantified financial impact has not yet been documented.
Deployment Context
Local Streamlit synthetic-data prototype with a documented Snowflake-backed deployment path; no public live-demo URL is published.
From: Current Implementation Status
Key Capabilities
- Data Analytics
- Workflow Automation
Evidence and Project Links
Related Projects
Engineering review
Technical Summary
A synthetic-data-based analytics platform for estimating work-order revenue, tracking delivery-center and field-operations labor, monitoring billing and other costs, calculating profit and loss, and identifying margin risk across the engineering work-order lifecycle.
System Architecture
Synthetic CSV dimensions and facts → validated data loader → work-order financial and lifecycle summary → revenue, labor, billing, cost, margin, and risk calculations → Streamlit dashboards and exports, with equivalent Snowflake schemas/views for a governed data path.
Algorithms and Models
Dataset / Data Basis
- Data / Evaluation Basis
- Synthetic engineering work-order lifecycle data covering revenue, delivery-center labor, field labor, billing, other costs, profit/loss, and margin-risk signals.
- Dataset size / benchmark scale
- 600 work orders; 2,660 work-unit revenue rows; 8,713 DWR activity/labor rows; 730 billing events; 977 other-cost rows; 2 labor-rate rows; and 16 milestone mappings.
Evaluation
Pytest covers core financial-metric behavior, while the application reports duplicates, orphan records, missing revenue, zero-hour events, and negative hours; no predictive-model benchmark is claimed.
Reproducibility Links
Original project record
Complete Technical Article
Original diagrams, implementation notes, code, tables, equations, metrics and documented limitations are preserved below.
Engineering Work Order Profit and Loss Analytics is a Streamlit and Snowflake-ready analytics prototype for estimating work-order revenue, tracking labor and operational costs, monitoring billing, calculating profit and loss, and identifying margin risk across the engineering delivery lifecycle.
View the GitHub Repository
Open the public repository on GitHub.
Wiki documentation: Home · Getting Started · Architecture · Data Model · Dashboard Guide
Application documentation: Synthetic Data · Financial Calculations · Snowflake Integration · Deployment
Engineering and governance: Testing and Quality · Security and Privacy · Troubleshooting · Roadmap
One-Line Idea
Turn fragmented engineering work-order revenue, labor, billing, and cost records into a single explainable profit-and-loss monitoring layer—without using confidential production data in the public repository.
Why This Project Exists
Engineering delivery teams often manage work orders through multiple operational and financial signals. Revenue may be represented through work units or sales-order lines. Labor effort may be recorded through activity or daily reports. Billing may arrive later through invoice or progress-billing events. Travel, permit, subcontractor, and exception costs may sit in separate sources.
This creates a visibility gap. A team may know that a work order is active, but not immediately know:
- how much revenue is currently forecast;
- how much delivery-center and field-operations labor has accumulated;
- whether billing is lagging behind operational progress;
- whether travel, rework, permitting, or other costs are consuming margin;
- which work orders are below target margin;
- which projects should be reviewed before they become losses.
This project organizes those signals into a synthetic, reproducible analytics platform that can be demonstrated publicly and later mapped to governed enterprise data sources.
The goal is not to create an audited accounting system. The goal is to create a practical operational analytics layer that helps engineering, operations, finance, and delivery leaders understand work-order profitability earlier in the lifecycle.
Project at a Glance
| Area | Description |
|---|---|
| Project type | Industrial analytics and decision-support prototype |
| Domain | Engineering work-order delivery, cost monitoring, billing visibility, and margin risk |
| Data mode | Fully synthetic public dataset |
| Primary inputs | Work orders, work-unit revenue, activity/labor events, billing events, other costs, labor rates, milestone mapping |
| Main output | One-row-per-work-order financial and lifecycle summary |
| Dashboard | Streamlit application with Plotly charts and downloadable summaries |
| Data warehouse path | Snowflake-ready schemas, analytical views, and quality checks |
| Core language | Python |
| Main libraries | pandas, Streamlit, Plotly, pytest |
| Documentation | README, architecture guide, data dictionary, root-level technical guides, and GitHub Wiki pages |
| Current maturity | Public synthetic-data MVP and reference architecture |
| Safety boundary | Demonstration only; not an audited finance, revenue-recognition, or accounting system |
What Makes the Platform Different
The project treats work-order profit and loss as both a financial analytics problem and a delivery lifecycle problem.
| Conventional approach | Platform approach |
|---|---|
| Review revenue, billing, and labor separately | Consolidate all signals into a work-order summary |
| Wait until late-stage billing to understand margin | Estimate margin throughout the lifecycle |
| Track labor totals without lifecycle context | Break effort down by milestone, activity type, and delivery organization |
| Look at financial performance only after completion | Flag high-risk work orders while they are still actionable |
| Treat rate assumptions as fixed code | Store rates as configurable data for scenario analysis |
| Ignore zero-hour lifecycle events | Retain them as operational milestones while excluding them from labor cost |
| Use confidential extracts for demos | Use deterministic synthetic data for public reproducibility |
| Build a dashboard without data-quality checks | Include duplicate, orphan, missing, zero-hour, and negative-hour checks |
Important: The repository is intentionally generic. It does not contain confidential customer, employee, operational, financial, or production data. All records, identifiers, names, rates, dates, and values are synthetic.
Reader Walkthrough
A reader can understand the platform in nine steps:
- Synthetic work-order master records define account, program, region, job category, status, intake date, and margin target.
- Work-unit revenue lines provide estimated revenue using quantity and unit-rate logic.
- Activity/labor records capture milestone, activity type, delivery organization, date, and hours.
- Billing events represent invoice or progress-billing activity.
- Other-cost records capture travel, permit, subcontractor, or miscellaneous expenses.
- Labor-rate assumptions convert hours into delivery-center and field-operations labor cost.
- The metric engine produces revenue, cost, margin, billed amount, variance, travel, rework, and risk reasons.
- The Streamlit dashboard exposes portfolio KPIs, drill-downs, lifecycle charts, rate scenarios, and quality checks.
- Snowflake SQL scripts show how the same logical model can be implemented over governed warehouse tables or views.
Platform Architecture
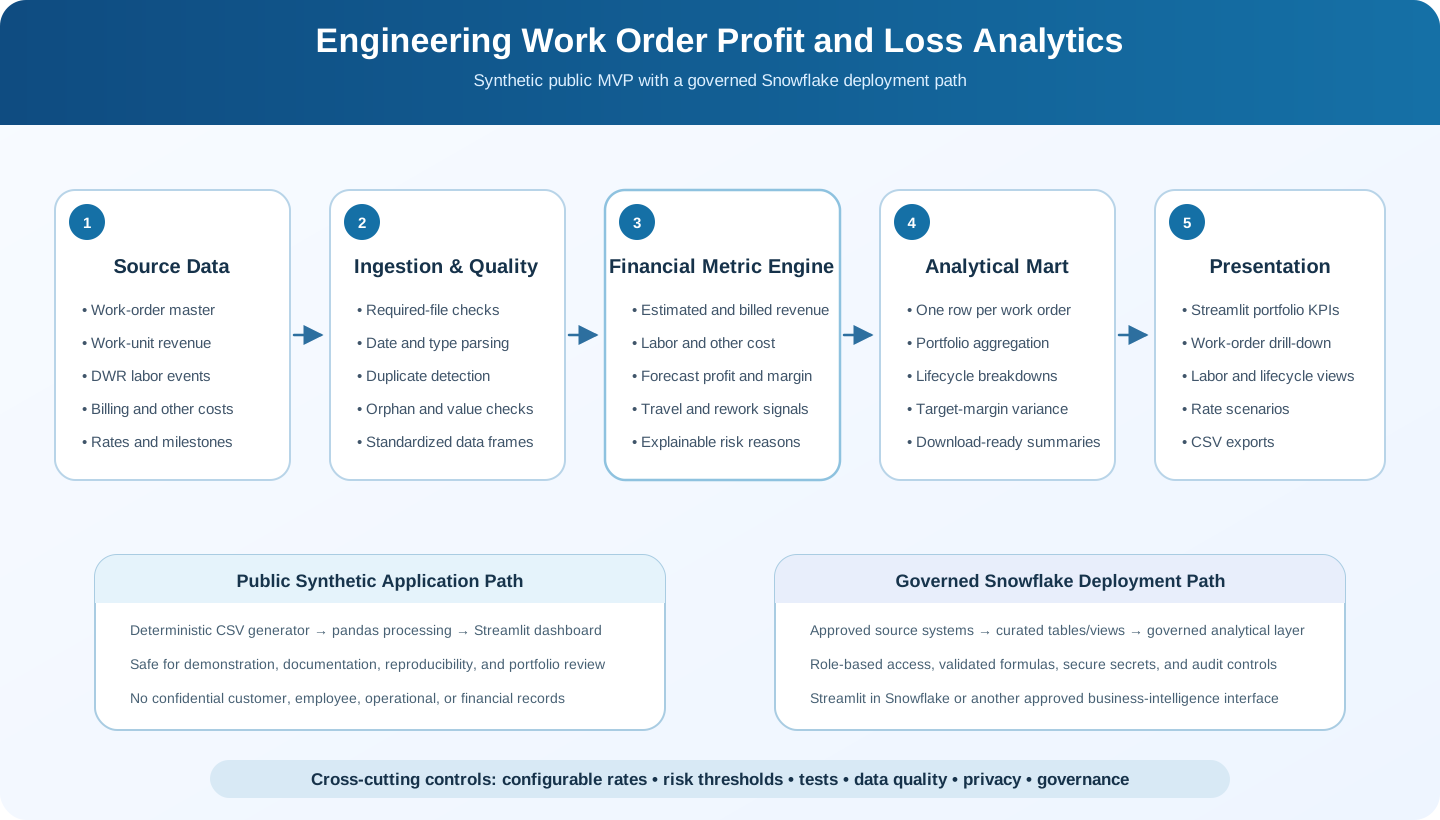
The platform is organized around two complementary implementation paths.
1. Synthetic Analytics Application
The public implementation loads deterministic synthetic CSV files, validates and standardizes the records, combines work-unit revenue, DWR labor, billing, and other-cost data, and produces a one-row-per-work-order financial summary. The Streamlit application presents portfolio KPIs, work-order drill-downs, lifecycle and labor analysis, rate scenarios, data-quality findings, risk reasons, and downloadable summaries.
2. Governed Snowflake Deployment
The production path replaces local CSV files with approved Snowflake tables or secure views. Snowflake-compatible schemas and analytical views support governed source mapping, configurable labor rates and thresholds, validated financial calculations, role-based access, and deployment through Streamlit in Snowflake or another approved analytics layer.
Read the Architecture Wiki page
Data Model
The project uses a compact star-style analytical model.
| Table | Grain | Purpose |
|---|---|---|
dim_work_order | One row per work order | Master work-order attributes and target margin |
fact_work_unit_revenue | One row per work-unit revenue line | Estimated revenue from work-unit quantity and rate |
fact_dwr_labor | One row per DWR labor or lifecycle event | Hours by milestone, activity type, and delivery organization |
fact_billing | One row per billing event | Invoice, progress billing, or billing status events |
fact_other_cost | One row per non-labor cost event | Travel, permit, subcontractor, or miscellaneous costs |
dim_labor_rate | One row per delivery organization/rate | Burdened hourly cost assumptions |
dim_milestone | One row per milestone/activity mapping | Lifecycle ordering and standardized activity grouping |
The central analytical output is a one-row-per-work-order summary used by the dashboard.
Synthetic Dataset
The bundled dataset is deterministic and can be regenerated with the default seed.
| Dataset | Rows | Analytical use |
|---|---|---|
| Work orders | 600 | Portfolio, filters, status, target margin, account/program/region/category |
| Work-unit revenue | 2,660 | Estimated revenue and sales-order/work-unit drill-down |
| DWR activity/labor records | 8,713 | Labor hours, lifecycle effort, delivery organization, travel, rework |
| Billing events | 730 | Billed amount, billing progress, billing visibility |
| Other costs | 977 | Travel, permit, subcontractor, and operational cost tracking |
| Labor rates | 2 | Delivery-center and field-operations rate assumptions |
| Milestone mapping | 16 | Lifecycle ordering and dashboard grouping |
The dataset spans January 2025 through May 2026 and is designed only for demonstration. It should not be interpreted as an industry benchmark.
Read the Synthetic Data Wiki page
Financial Calculation Engine
The core calculations are intentionally transparent.
Estimated Revenue = Σ(Work Unit Quantity × Item Rate)Labor Cost = Σ(Activity Hours × Applicable Hourly Rate)Actual Cost = Labor Cost + Other CostForecast Revenue = MAX(Estimated Revenue, Billed Revenue)Forecast Margin = Forecast Revenue − Actual CostForecast Margin % = Forecast Margin ÷ Forecast RevenueMargin Variance % = Forecast Margin % − Target Margin %Risk bands are rule-based and interpretable.
| Risk band | Example trigger |
|---|---|
| High | Margin below high-risk threshold, high rework, or high travel |
| Medium | Margin below medium-risk threshold, moderate rework, or moderate travel |
| Low | No configured risk condition is met |
The platform exposes risk reasons instead of hiding them inside an opaque score. This makes the dashboard easier to review with operations and finance stakeholders.
Read the Financial Calculations Wiki page
Dashboard Experience
The Streamlit dashboard is organized around practical questions.
Portfolio Overview
Shows total revenue, cost, profit, margin, billed amount, risk distribution, program-level performance, regional performance, and a downloadable work-order summary.
Work Order Detail
Provides a drill-down into one selected work order, including work-unit revenue, billing history, other costs, lifecycle activity, labor hours, margin, and risk reason.
Lifecycle and Labor
Compares hours across milestones and delivery organizations. This helps identify where effort is being consumed across intake, planning, field operations, design, permitting, delivery, and billing.
Rate Scenario
Allows users to change delivery-center and field-operations hourly rates and immediately observe how profit, margin, and risk counts change.
Data Quality
Surfaces potential duplicate work-unit rows, orphan activity records, zero-hour lifecycle events, negative hours, and work orders without revenue lines.
Snowflake-Ready Integration
The implementation includes Snowflake-oriented SQL inside the application folder.
| Repository file | Purpose |
|---|---|
insite_pl_mvp/sql/snowflake_schema.sql | Defines Snowflake tables for the logical work-order model |
insite_pl_mvp/sql/mvp_views.sql | Builds analytical views for revenue, labor, billing, cost, margin, and work-order reporting |
insite_pl_mvp/tests/test_metrics.py | Validates core metric behavior; application-level data-quality findings are displayed in Streamlit |
A production implementation should not upload confidential data into a public repository. Instead, it should map approved enterprise source fields into curated warehouse tables or secure views and connect the dashboard to those governed objects.
Read the Snowflake Integration Wiki page
Technology Stack
| Layer | Technologies |
|---|---|
| Application | Streamlit |
| Language | Python |
| Data processing | pandas |
| Visualization | Plotly |
| Testing | pytest and local validation |
| Data warehouse path | Snowflake SQL |
| Documentation | Markdown, README, docs, GitHub Wiki |
| Data | Synthetic CSV files generated by Python |
| Packaging | requirements.txt and setup scripts |
Repository Structure
Engineering-Work-Order-Profit-and-Loss-Analytics/├── assets/│ └── diagrams/│ └── workorder_profit_loss_architecture.svg├── insite_pl_mvp/│ ├── data/│ │ ├── dim_labor_rate.csv│ │ ├── dim_milestone.csv│ │ ├── dim_work_order.csv│ │ ├── fact_billing.csv│ │ ├── fact_dwr_labor.csv│ │ ├── fact_other_cost.csv│ │ └── fact_work_unit_revenue.csv│ ├── scripts/│ │ └── generate_synthetic_data.py│ ├── sql/│ │ ├── mvp_views.sql│ │ └── snowflake_schema.sql│ ├── src/│ │ ├── __init__.py│ │ ├── data_loader.py│ │ └── metrics.py│ ├── tests/│ │ └── test_metrics.py│ ├── DATA_DICTIONARY.md│ ├── README.md│ ├── app.py│ ├── requirements.txt│ ├── setup_and_run.bat│ └── setup_and_run.ps1├── A-Z_FILE_GUIDE.md├── ARCHITECTURE.md├── CHANGELOG.md├── CODE_OF_CONDUCT.md├── CONTRIBUTING.md├── DATA_DICTIONARY.md├── GITHUB_REPOSITORY_SETUP.md├── PROJECT_STRUCTURE.md├── README.md├── ROADMAP.md├── SECURITY.md├── configuration.md├── data-model.md├── deployment.md├── developer-guide.md├── faq.md├── financial-calculations.md├── installation.md├── security-privacy.md├── snowflake-integration.md├── synthetic-data.md├── testing.md├── troubleshooting.md└── user-guide.mdRead the Project Structure guide
Local Run
Clone the repository and enter the application folder:
git clone https://github.com/dranubhaparashar/Engineering-Work-Order-Profit-and-Loss-Analytics.gitcd Engineering-Work-Order-Profit-and-Loss-Analytics\insite_pl_mvpWindows one-click setup
.\setup_and_run.ps1Alternatively, double-click:
setup_and_run.batWindows manual setup
py -m venv .venv.\.venv\Scripts\Activate.ps1python -m pip install --upgrade pippip install -r requirements.txtstreamlit run app.pymacOS or Linux
git clone https://github.com/dranubhaparashar/Engineering-Work-Order-Profit-and-Loss-Analytics.gitcd Engineering-Work-Order-Profit-and-Loss-Analytics/insite_pl_mvppython3 -m venv .venvsource .venv/bin/activatepython -m pip install --upgrade pippip install -r requirements.txtstreamlit run app.pyOpen the Streamlit URL shown in the terminal, normally:
http://localhost:8501Current Implementation Status
| Capability | Status |
|---|---|
| Synthetic dataset generation | Implemented |
| Streamlit dashboard | Implemented |
| Work-order financial summary | Implemented |
| Work-unit revenue aggregation | Implemented |
| Labor-cost calculation | Implemented |
| Other-cost integration | Implemented |
| Billing visibility | Implemented |
| Margin and risk classification | Implemented |
| Rate scenario analysis | Implemented |
| Data-quality page | Implemented |
| Snowflake schema and views | Implemented |
| Automated pytest coverage | Implemented (insite_pl_mvp/tests/test_metrics.py) |
| GitHub Actions workflow | Not currently present in the live repository |
| GitHub Wiki content | Included |
| Enterprise authentication | Not included in public demo |
| Audited finance/accounting controls | Not included |
| Real production data integration | Intentionally not included |
Known Limitations
The project is designed as a public, synthetic demonstration. Important limitations include:
- The financial logic is not an accounting standard and should not be treated as audited finance logic.
- Revenue recognition, overhead allocation, tax, cost capitalization, and labor-burden rules vary by organization.
- The risk model is rules-based rather than predictive or statistically validated.
- CSV loading is appropriate for an MVP; production usage should rely on governed warehouse views.
- The bundled dataset is synthetic and should not be interpreted as an industry performance benchmark.
- Authentication, authorization, row-level security, audit logging, and secrets management must be added for real deployments.
- Any mapping to enterprise data must be approved by the data owner and reviewed for privacy, pricing, contract, employee, and customer sensitivity.
These limitations are explicitly documented so the portfolio post does not overclaim the maturity or authority of the platform.
Roadmap
Phase 1 — Public Synthetic MVP
- Provide a complete synthetic dataset.
- Build a Streamlit dashboard.
- Add profit-and-loss calculations.
- Add rate scenarios and data-quality checks.
- Document the repository and Wiki.
Phase 2 — Warehouse-Backed Analytics
- Replace CSV reads with Snowflake views.
- Add configuration for environment-specific sources.
- Materialize the work-order summary model.
- Add row-level access controls and secure roles.
- Validate field mappings with finance and operations stakeholders.
Phase 3 — Operational Governance
- Add authentication and authorization.
- Add audit logging for exports and scenario assumptions.
- Define approved margin thresholds and exception workflows.
- Add reviewer notes, dispositions, and follow-up ownership.
Phase 4 — Advanced Intelligence
- Add anomaly detection for unusual labor, travel, rework, or billing lag.
- Add forecasting for likely final margin.
- Add explainable drivers for margin deterioration.
- Add project-completion and cash-flow forecasting.
Security, Privacy, and Claim Boundary
Work-order financial analytics can involve sensitive information, including customer names, employee identifiers, labor rates, contract terms, billing values, site locations, operational notes, and internal margin targets.
The public repository therefore follows a strict boundary:
- no confidential company data;
- no customer or employee records;
- no production work-order numbers;
- no real billing or pricing extracts;
- no proprietary internal source files;
- no credentials or secrets;
- no claim of audited financial correctness.
Before connecting the project to real systems, teams should obtain written approval, use role-based access control, mask sensitive fields, keep secrets outside source control, validate all formulas, and review repository history before publication.
Testing and Validation Strategy
The repository includes automated tests for data quality and financial logic. A stronger production test plan should add:
- source-to-target reconciliation tests;
- revenue aggregation tests;
- labor-rate effective-date tests;
- billing status tests;
- margin-threshold boundary tests;
- duplicate and orphan record tests;
- large-data performance tests;
- dashboard regression tests;
- Snowflake view validation;
- security and access-control tests;
- finance stakeholder sign-off.
Complete Wiki Documentation
| Wiki page | Purpose |
|---|---|
| Wiki Home | Project entry point and documentation navigation |
| Getting Started | Local setup and first run |
| Architecture | System layers, data flow, and deployment patterns |
| Data Model | Dimensions, facts, grain, and join logic |
| Dashboard Guide | Dashboard pages and user workflow |
| Synthetic Data | Generator, fields, assumptions, and safe public data policy |
| Financial Calculations | Revenue, cost, margin, billing, and risk formulas |
| Snowflake Integration | Warehouse schema, views, and production mapping |
| Deployment | Local, Streamlit, and Snowflake deployment options |
| Testing and Quality | Automated checks and production validation plan |
| Troubleshooting | Common setup and runtime issues |
| Security and Privacy | Safe public-use boundary and real-data controls |
| FAQ | Common user and developer questions |
| Roadmap | Future development phases |
Practical Use Cases
| User group | How the platform helps |
|---|---|
| Engineering managers | Monitor work-order margin risk across active delivery work |
| Operations leaders | Identify where labor, travel, or rework is increasing cost |
| Finance analysts | Compare forecast revenue, billed revenue, cost, and margin |
| Delivery-center teams | Understand lifecycle effort and milestone-level workload |
| Field-operations teams | Review travel-heavy or field-hour-heavy work orders |
| Data engineers | Use the logical model to design Snowflake views |
| BI developers | Adapt the metric layer into dashboards or reporting systems |
| Governance teams | Review synthetic-data, security, privacy, and claim boundaries |
| Portfolio reviewers | Evaluate project performance without exposing confidential data |
Key Strengths
- Uses fully synthetic public data.
- Demonstrates a complete work-order analytics workflow.
- Combines revenue, labor, billing, other costs, and risk into one model.
- Preserves drill-down detail while also producing portfolio KPIs.
- Provides clear formulas instead of opaque financial logic.
- Separates delivery-center and field-operations labor assumptions.
- Includes travel and rework risk indicators.
- Includes data-quality checks inside the application.
- Provides Snowflake-ready schema and analytical views.
- Includes README, architecture documentation, data dictionary, implementation guides, and GitHub Wiki pages.
- Avoids company-specific, customer-specific, or source-system-specific public claims.
Key Innovation
The strongest contribution is the translation of scattered work-order operational and financial events into a transparent, explainable, and privacy-safe profit-and-loss monitoring layer.
The project shows how a team can move from late-stage financial visibility to lifecycle-based margin awareness. Instead of waiting until final billing, stakeholders can review estimated revenue, accumulated labor, non-labor costs, billing progress, target-margin variance, and risk reasons while the work order is still active.
Project Links
- GitHub Repository
- GitHub Wiki
- README
- Application Folder
- Architecture
- Data Dictionary
- Financial Calculations
- Snowflake Integration
- Streamlit App
- Metric Engine
- Synthetic Data Generator
- Snowflake Schema
- Analytical Views
- Tests
- Testing and Quality
- Security and Privacy
- Roadmap
Conclusion
Engineering Work Order Profit and Loss Analytics demonstrates how synthetic data, transparent calculations, and a lightweight dashboard can turn fragmented delivery and financial events into actionable work-order intelligence.
The platform estimates revenue from work-unit lines, prices labor through configurable rate assumptions, adds operational costs, monitors billing events, calculates forecast margin, and surfaces risk reasons that stakeholders can understand. Its value is strongest as a reproducible public MVP and reference architecture for teams that want to build safer, governed work-order financial analytics without exposing confidential data.
The next step for a real organization would be controlled source mapping, finance-approved formulas, warehouse-level governance, access control, audit logging, and validation against approved historical records.
Final Thought
Estimate early. Track continuously. Explain margin risk. Protect sensitive data.
Work-order revenue · labor cost · billing visibility · profit and loss · margin risk · synthetic data · Streamlit · Snowflake-ready analytics · complete GitHub Wiki
Related Technical Projects
MedClaim Sentinel: Local Multimodal AI for Medical Insurance Claim OCR, Duplicate Detection, Clinical Consistency, and Review Chat
AI-Powered Telecom Copper Reclamation: Document Intelligence and Workflow Automation for ACR/CAPR/CPR Analysis
Comments